|

October 2018 REBGV Market Update
Daneshmand Magazine - November 15, 2018

October 2018 Stats Package


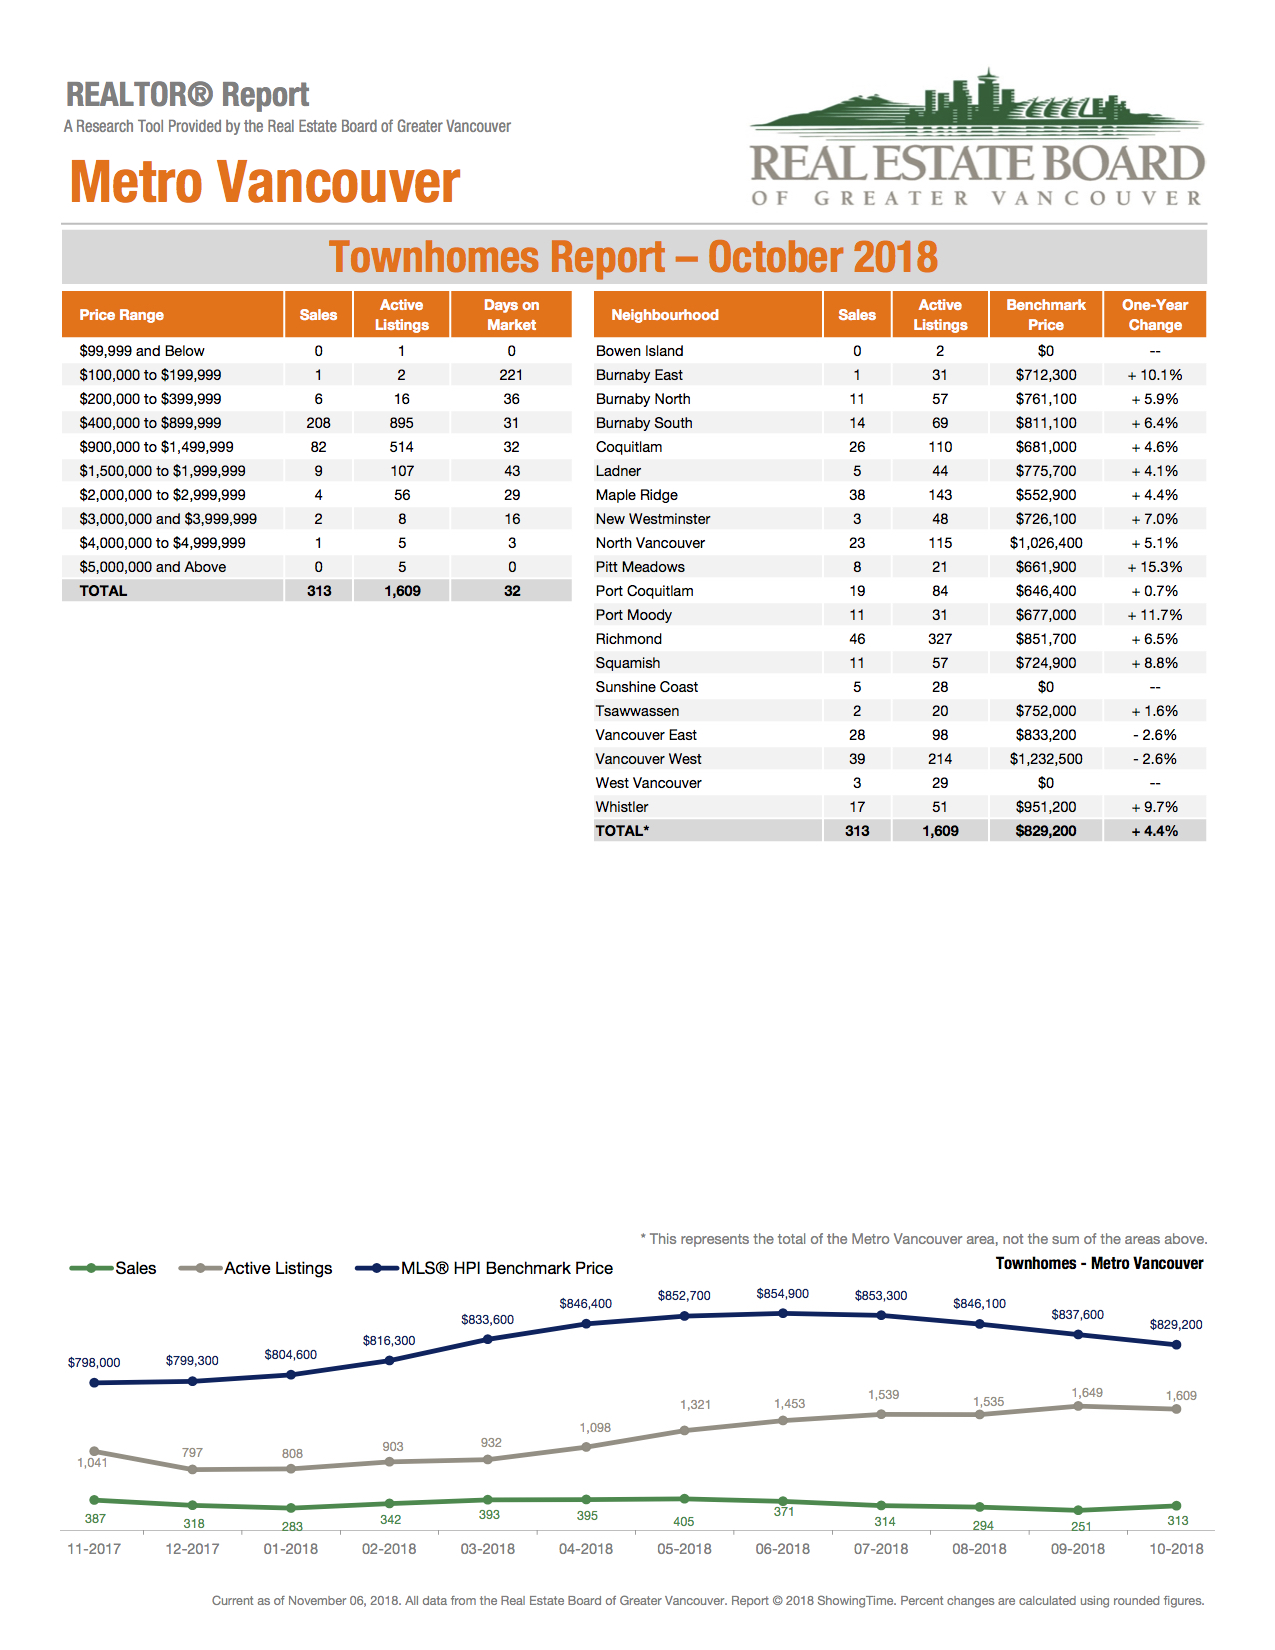

Listings High, Sales Low in October
|
From BBC News: Scientist Report on climate change
Final call to save the world from 'climate catastrophe'
For full artcile please click on the link:
https://www.bbc.com/news/science-environment-45775309
Daneshmand Magazine - October 13, 2018

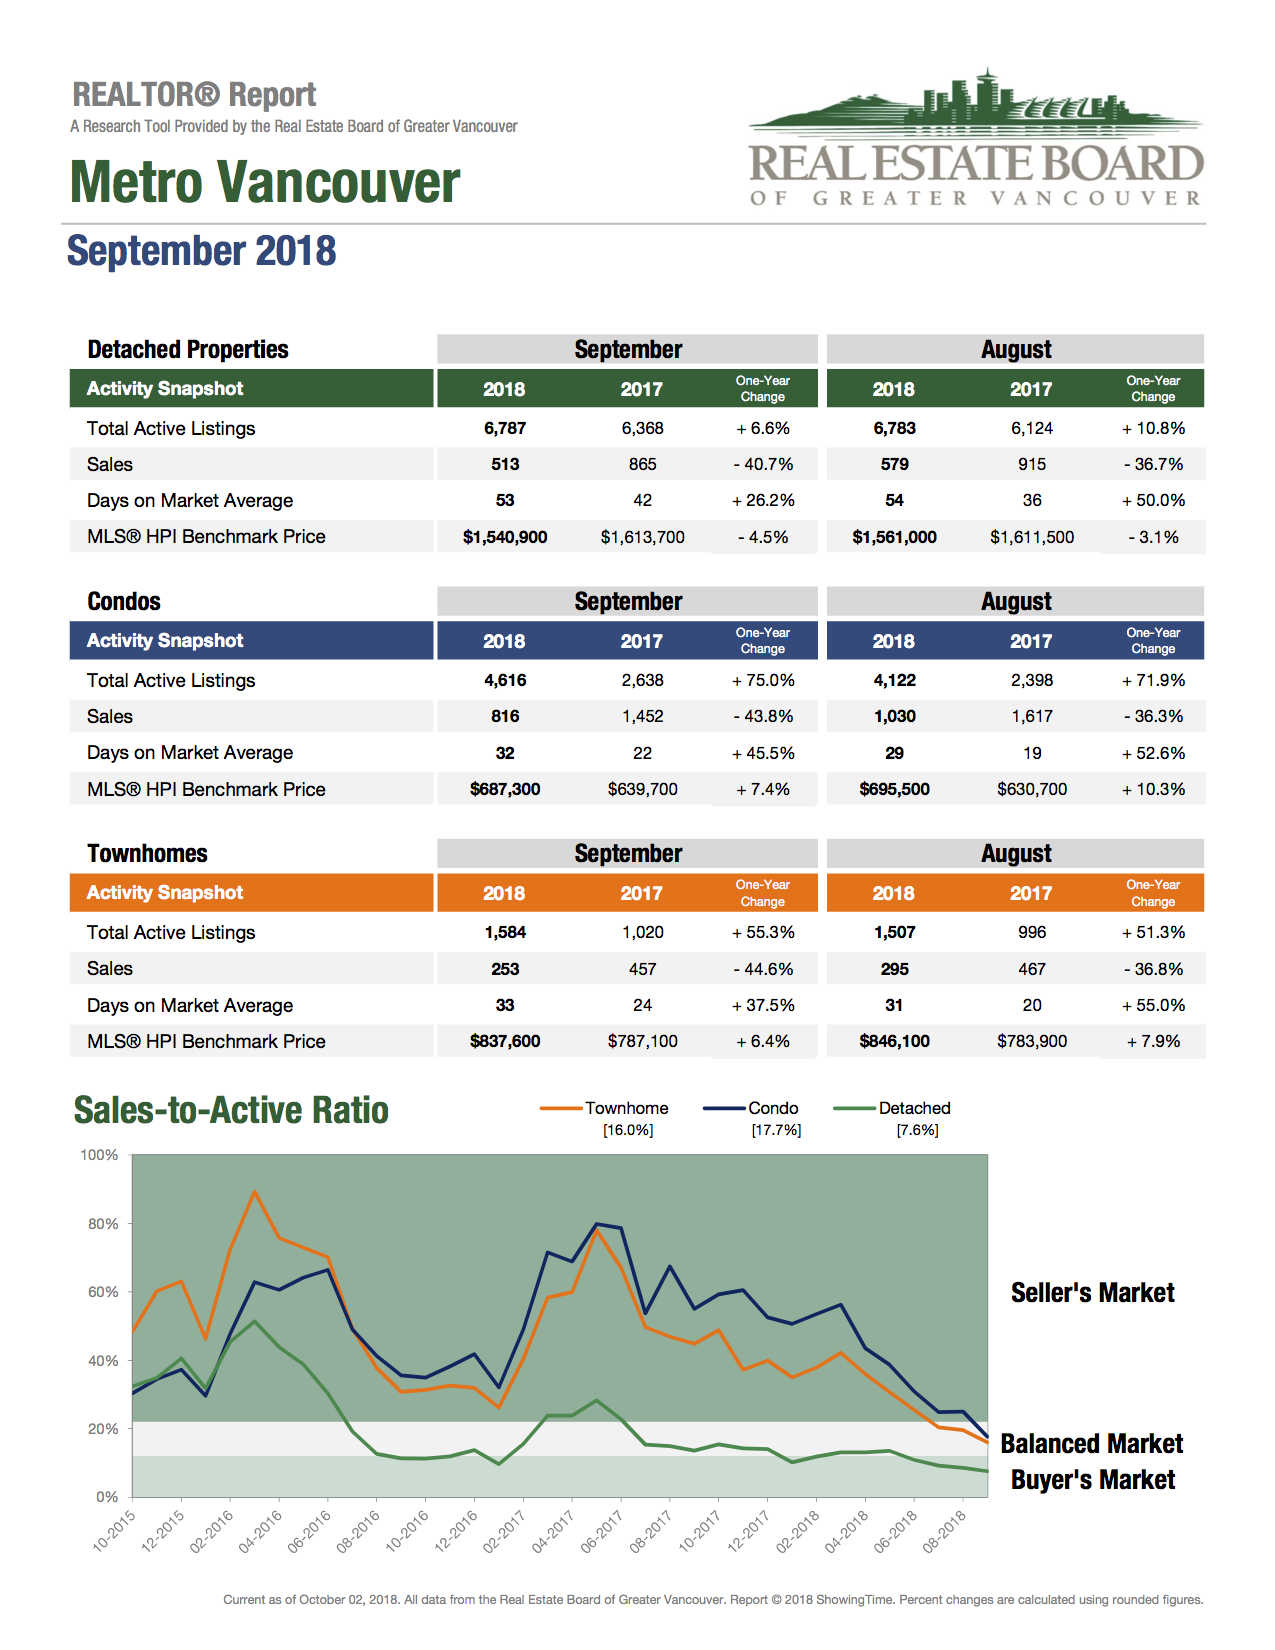
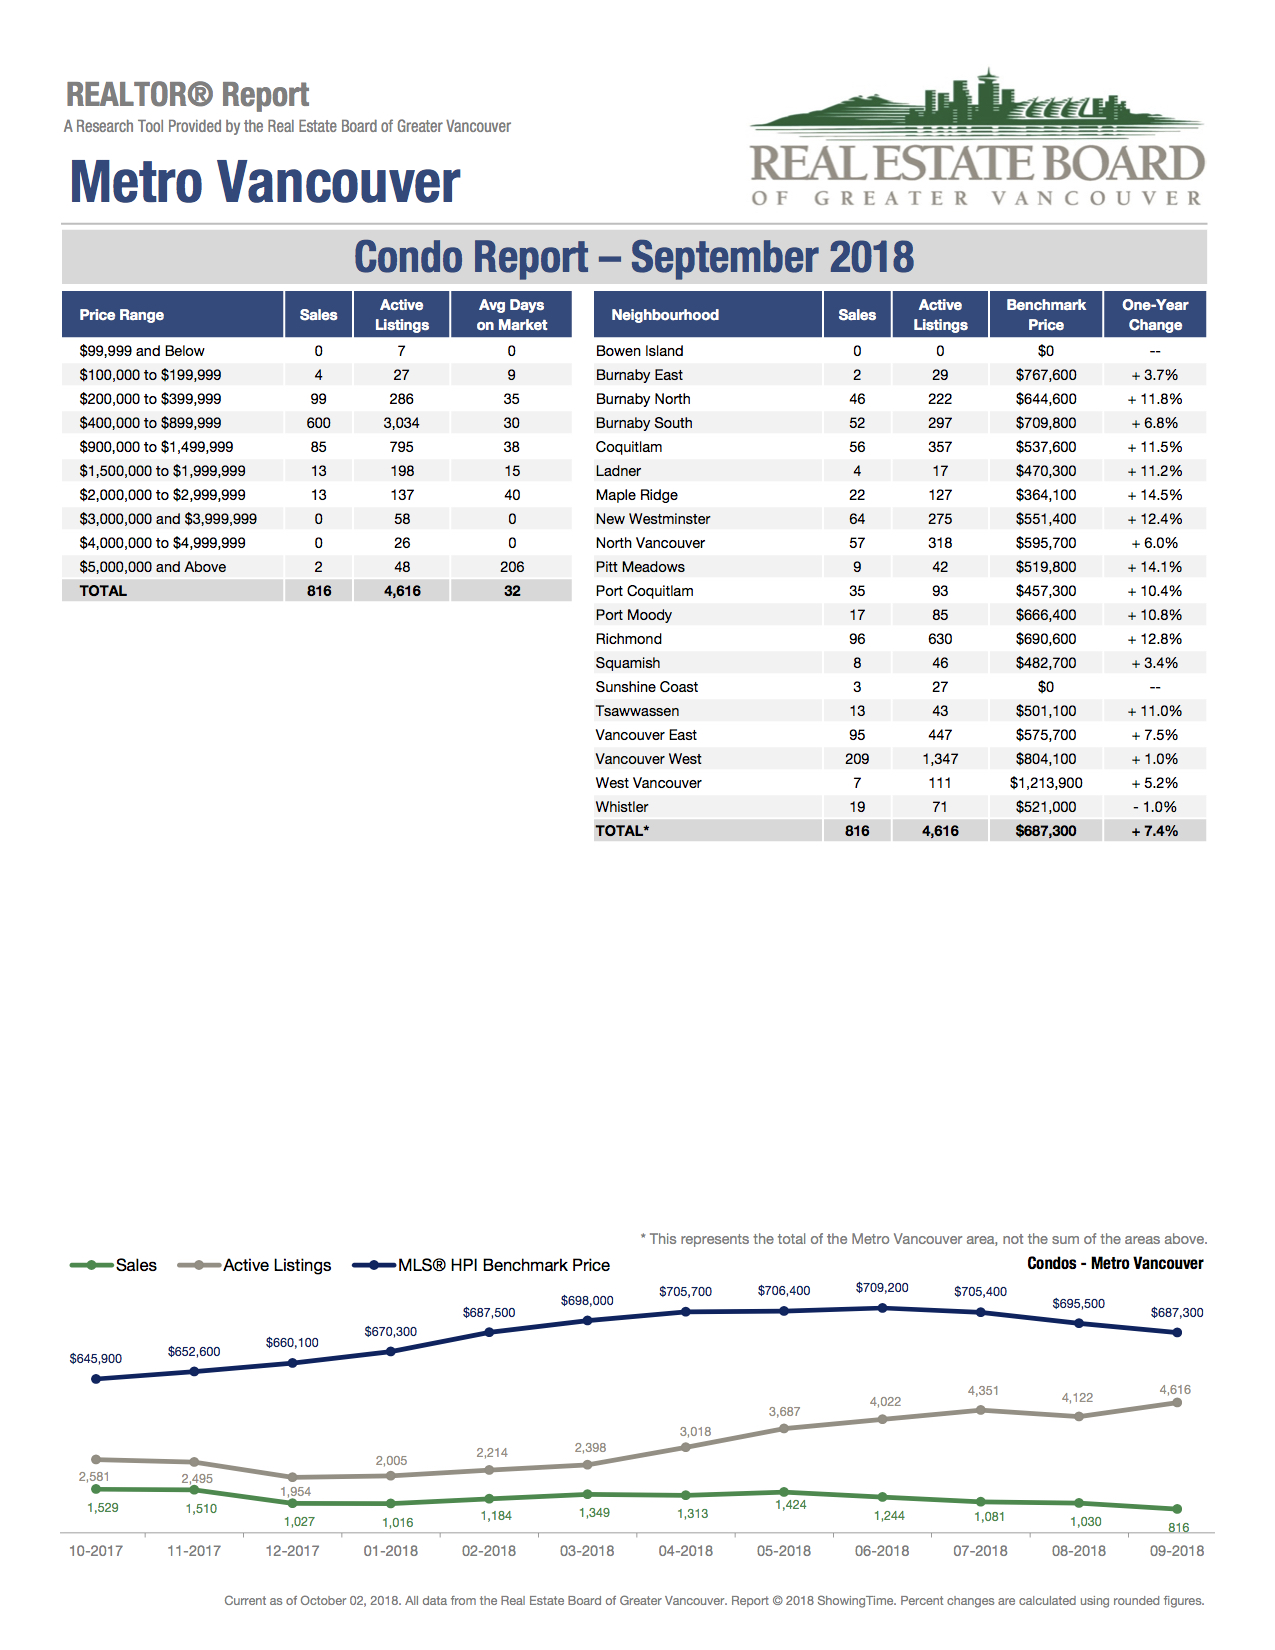
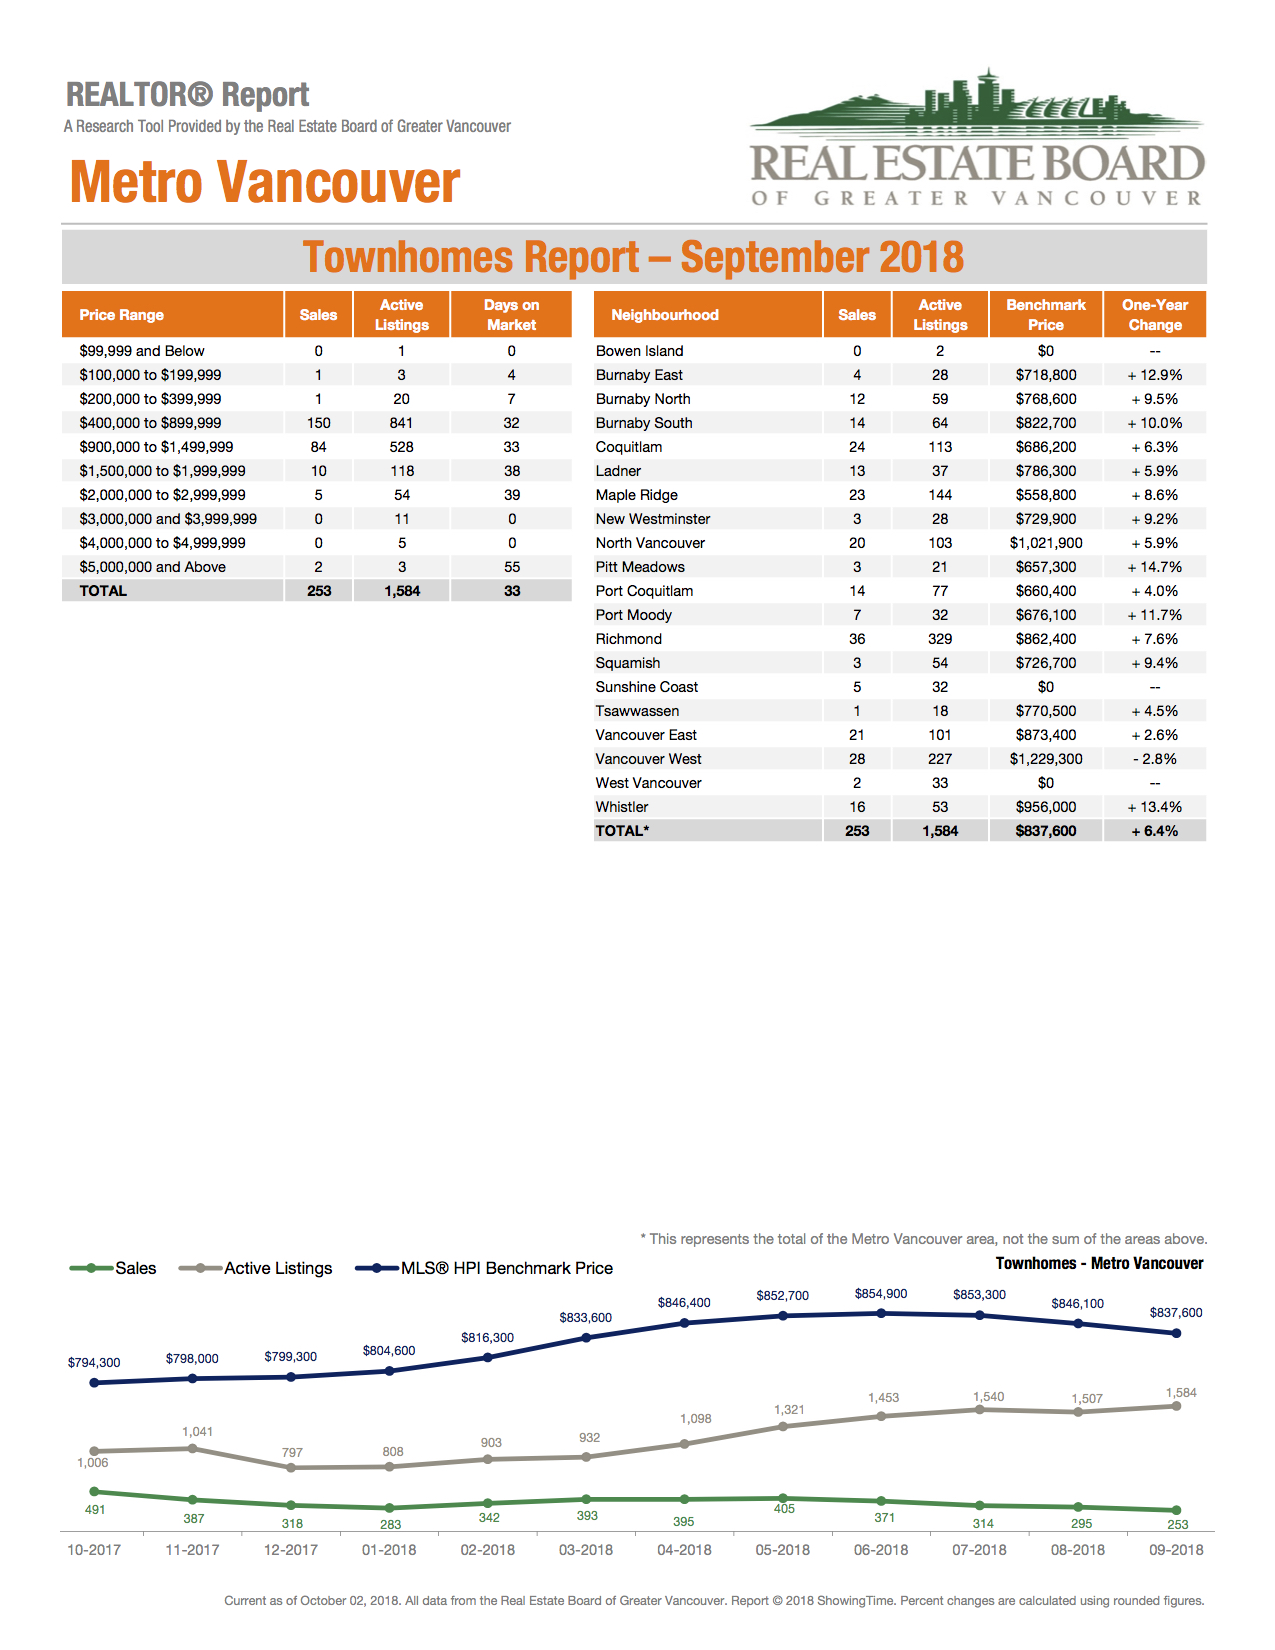
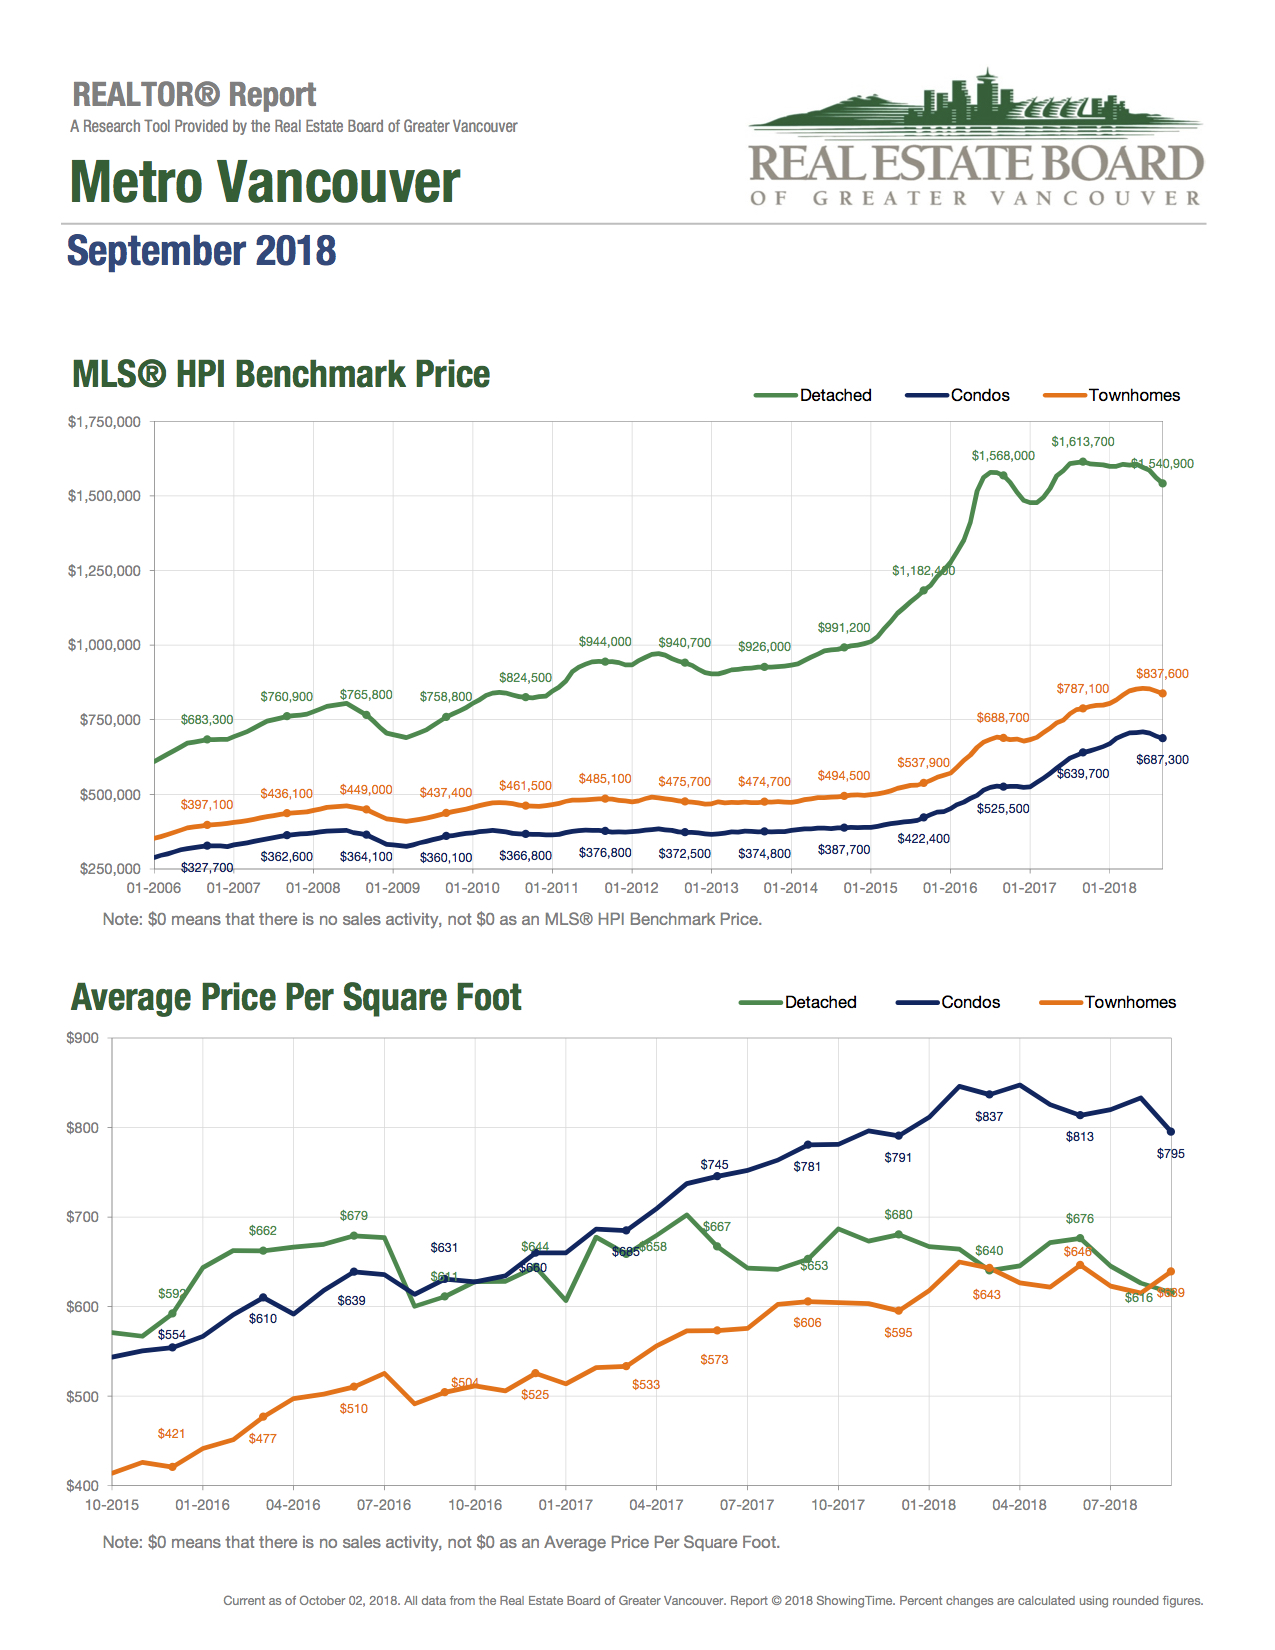
September 2018 REBGV Market Update
September 2018 Stats Package

Commercial Real Estate Sales Down
|

August 2018 Market Highlight

Home buyer demand stays below historical averages in August
The Metro Vancouver* housing market continues to experience reduced demand across all housing types.
The Real Estate Board of Greater Vancouver (REBGV) reports that residential home sales in the region totalled 1,929 in August 2018, a 36.6 per cent decrease from the 3,043 sales recorded in August 2017, and a 6.8 per cent decline compared to July 2018 when 2,070 homes sold.
Last month’s sales were 25.2 per cent below the 10-year August sales average.
“Home buyers have been less active in recent months and we’re beginning to see prices edge down for all housing types as a result,” Phil Moore, REBGV president said. “Buyers today have more listings to choose from and face less competition than we’ve seen in our market in recent years.”
There were 3,881 detached, attached and apartment homes newly listed for sale on the Multiple Listing Service® (MLS®) in Metro Vancouver in August 2018. This represents an 8.6 per cent decrease compared to the 4,245 homes listed in August 2017 and an 18.6 per cent decrease compared to July 2018 when 4,770 homes were listed.
The total number of homes currently listed for sale on the MLS® system in Metro Vancouver is 11,824, a 34.3 per cent increase compared to August 2017 (8,807) and a 2.6 per cent decrease compared to July 2018 (12,137).
The sales-to-active listings ratio for August 2018 is 16.3 per cent. By housing type, the ratio is 9.2 per cent for detached homes, 19.4 per cent for townhomes, and 26.6 per cent for apartments.
Generally, analysts say that downward pressure on home prices occurs when the ratio dips below the 12 per cent mark for a sustained period, while home prices often experience upward pressure when it surpasses 20 per cent over several months.
“With fewer buyers active in the market, benchmark prices across all three housing categories have declined for two consecutive months across the region,” Moore said.
The MLS® Home Price Index composite benchmark price for all residential properties in Metro Vancouver is currently $1,083,400. This represents a 4.1 per cent increase over August 2017 and a 1.9 per cent decrease since May 2018.
Sales of detached properties in August 2018 reached 567, a 37.1 per cent decrease from the 901 detached sales recorded in August 2017. The benchmark price for detached properties is $1,561,000. This represents a 3.1 per cent decrease from August 2017 and a 2.8 per cent decrease since May 2018. Sales of apartment properties reached 1,025 in August 2018, 36.5 per cent decrease compared to the 1,613 sales in August 2017. The benchmark price of an apartment property is $695,500. This represents a 10.3 per cent increase from August 2017 and a 1.6 per cent decrease since May 2018.
Attached property sales in August 2018 totalled 337, a 36.3 per cent decrease compared to the 529 sales in August 2017. The benchmark price of an attached unit is $846,100. This represents a 7.9 per cent increase from August 2017 and a 0.8 per cent decrease since May 2018.
Download the August 2018 stats package
August 2018 REBGV Market Update
Office Address:
201-2403 Marine Drive
West Vancouver, BC, V7V 1L3